Pet Spending Statistics USA
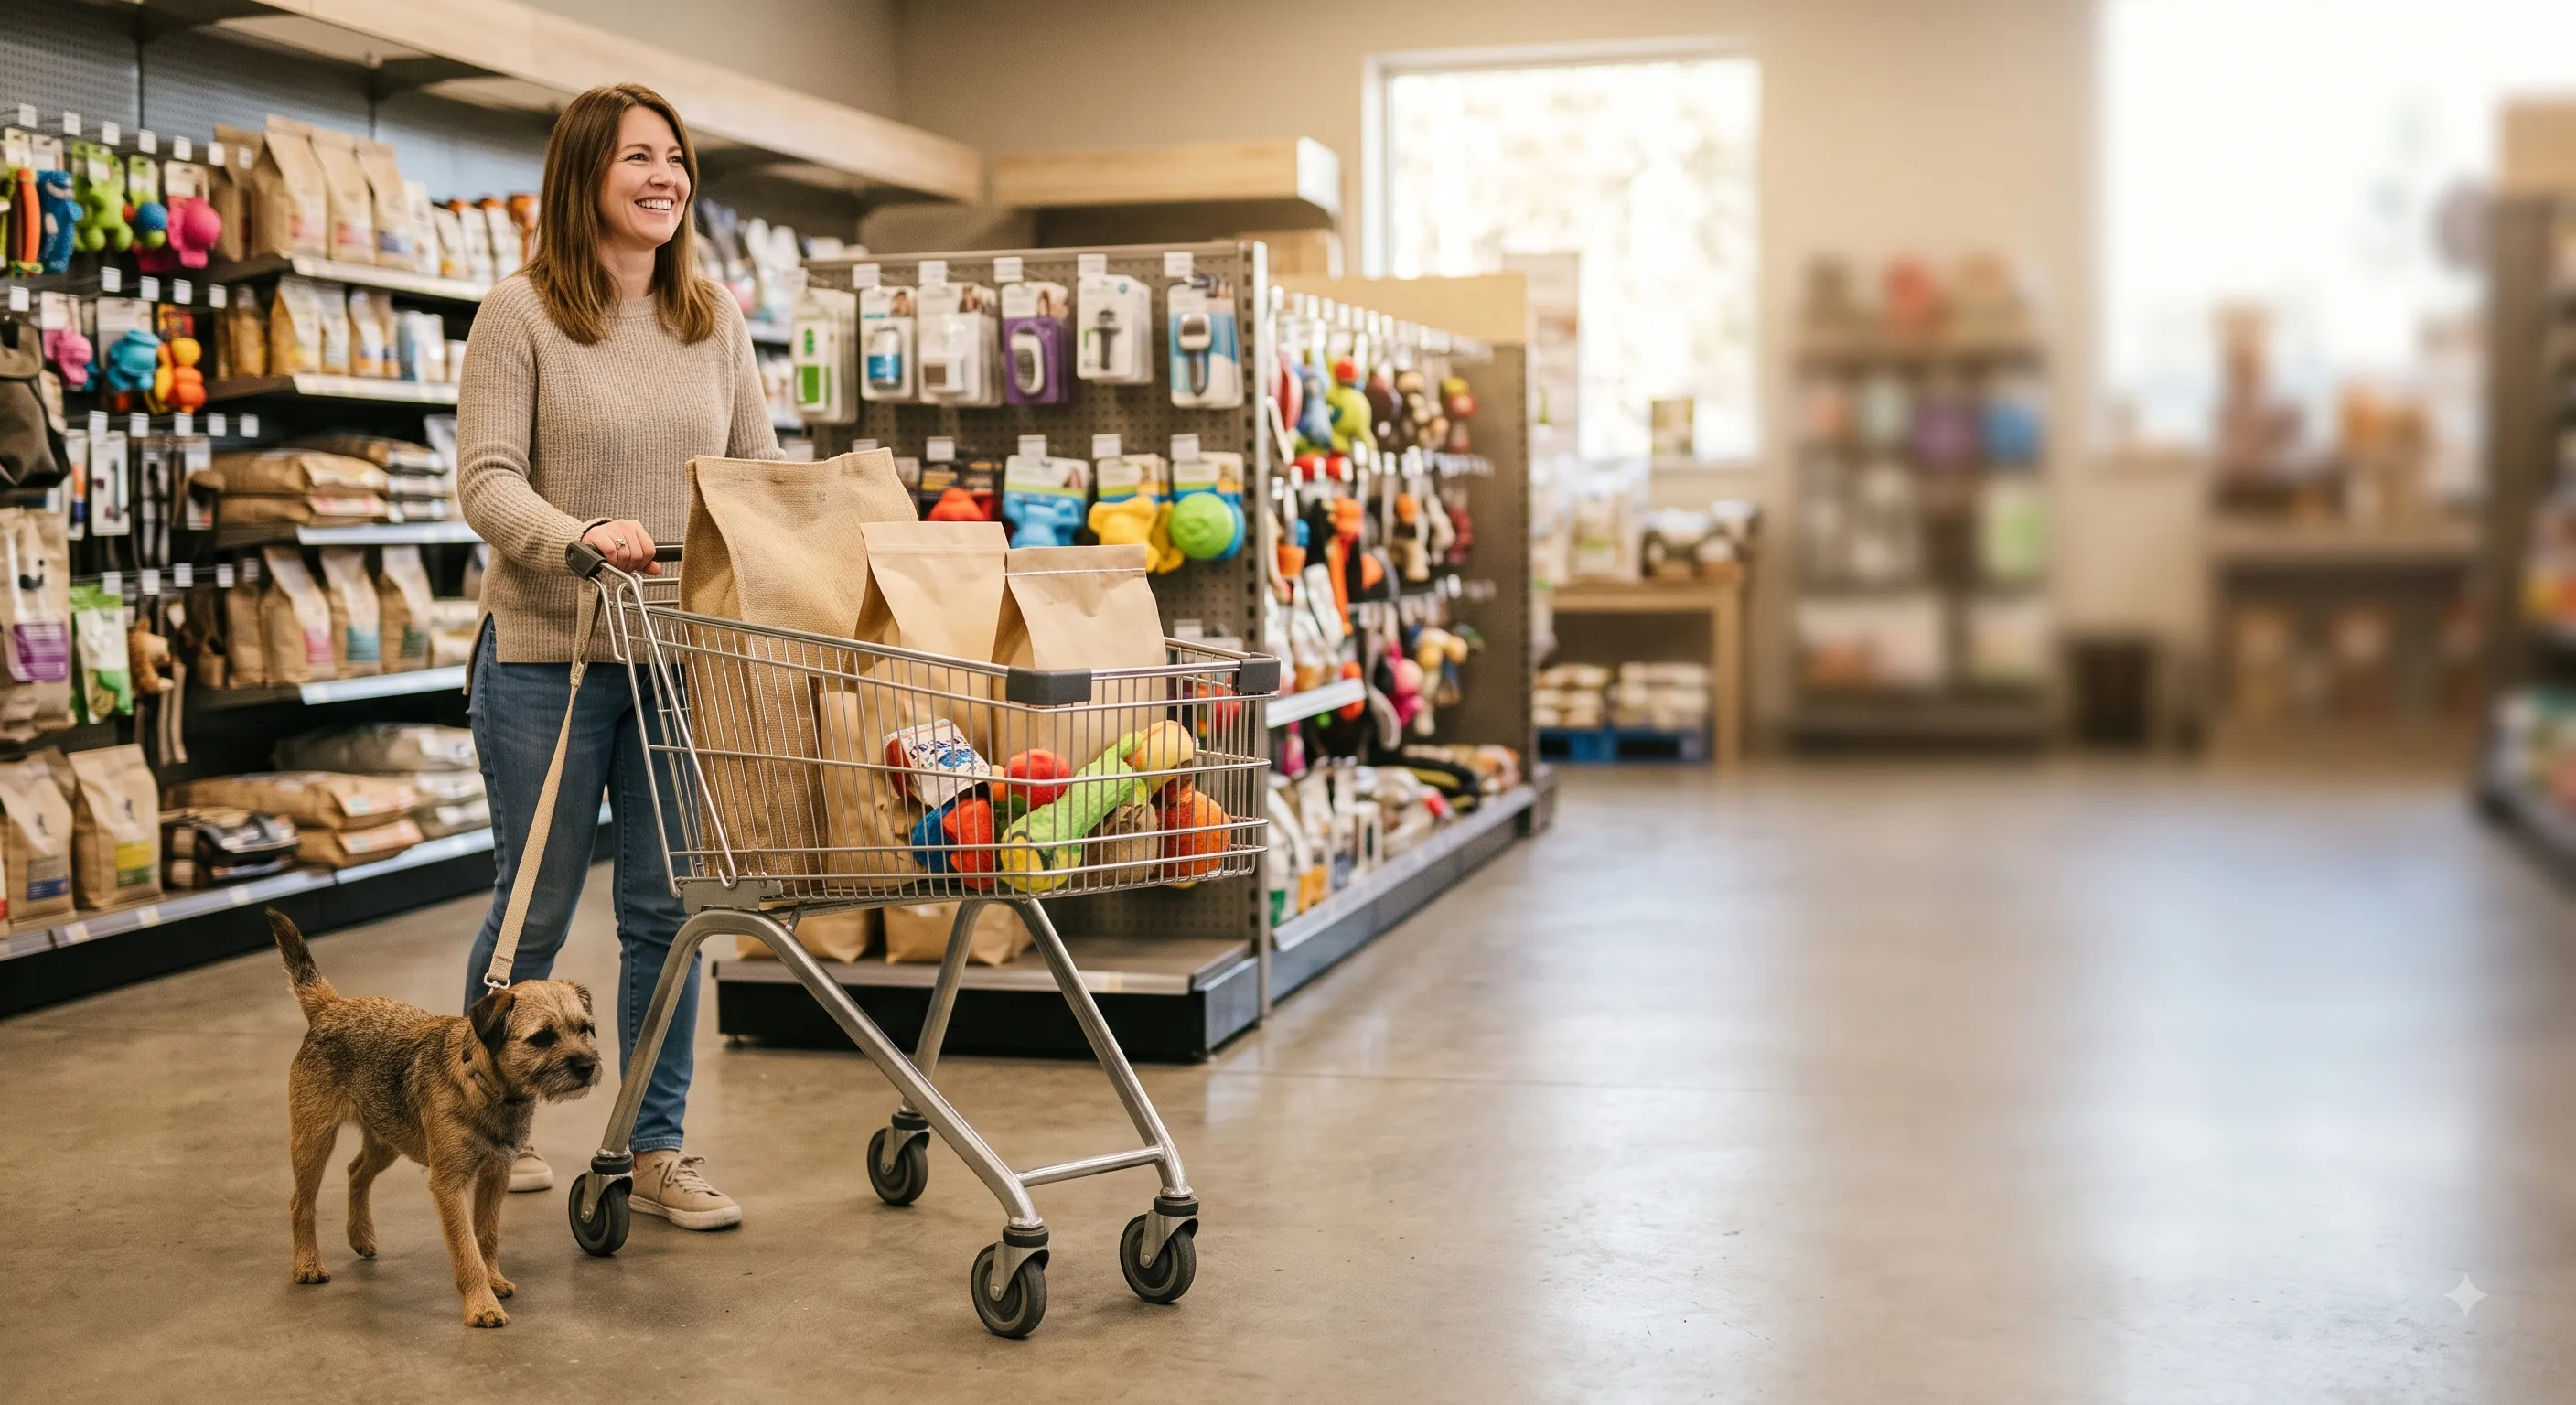
Americans spent $158 billion on their pets in 2025, and that figure is projected to climb to $165 billion in 2026 — but how that money gets spent is shifting. More owners are trading down to cheaper food, grooming at home instead of booking a salon, and cutting back on treats, even as total industry spending keeps setting records.
The statistics below come from the American Pet Products Association's (APPA) State of the Industry reporting and its dog-owner spending research, along with AVMA's separately surveyed household spending data.
Key Statistics
Up 3.7% from 2024, per APPA's State of the Industry reporting.
Projected +4.4% growth, ~2 points of which is inflation.
Food & treats' share of total industry spending in 2025.
AVMA's directly surveyed household total, excluding adoption/purchase fees.
Up from roughly 12% the year before, per APPA (2025).
North American premium volume growth, 2024 (AVMA).
Statistics Summary
| Statistic | Value |
|---|---|
|
US Pet Industry Spending (2025)
Up 3.7% from 2024, per APPA's State of the Industry reporting. |
158B USD |
|
2026 Spending Projection
Projected +4.4% growth, ~2 points of which is inflation. |
165B USD |
|
Largest Spending Category
Food & treats' share of total industry spending in 2025. |
43.2% |
|
Avg. Household Pet Spending (2024)
AVMA's directly surveyed household total, excluding adoption/purchase fees. |
1,515USD |
|
Owners Who Decreased Spending
Up from roughly 12% the year before, per APPA (2025). |
22% |
|
Pet Insurance Premium Growth
North American premium volume growth, 2024 (AVMA). |
20.8% |
Total U.S. Pet Industry Spending
Total pet industry expenditures reached $152 billion in 2024, grew to $158 billion in 2025 (+3.7%), and are projected to reach $165 billion in 2026 (roughly +4.4%, with about 2 percentage points of that driven by inflation), according to APPA's State of the Industry reporting.
Where the Money Goes
Food and treats remain the largest spending category by far, at $68.3 billion (43.2% of total industry spending) in 2025, followed by veterinary care and products at $41 billion (25.9%) and supplies, live animals, and OTC medicines at $34.4 billion (21.8%). Looking specifically at dog owners' household budgets, APPA's July 2026 dog-owner report found veterinary care made up 29% of wallet share and food 27% — together, more than half of what a typical dog owner spends on their pet in a year.
How Much Does a Pet-Owning Household Spend?
AVMA's separately conducted survey found average annual household spending of $1,515 in 2024 (not including adoption or purchase fees), with veterinary care making up roughly a third of that total — though vet-care spending specifically fell 4% from 2023 to 2024. This AVMA figure is a directly surveyed household total from a different survey than APPA's category-by-category data, so the two shouldn't be added together or treated as measuring the same thing.
Owners Are Trading Down, Not Cutting Out
About half of pet owners kept their spending unchanged over the past year, while 22% decreased spending — nearly double the roughly 12% who cut back the year before — according to APPA's March 2026 report, with the pullback concentrated in essential care over discretionary purchases rather than owners giving up their pets. Dog owners are trading down within categories, too: discount-retailer dog food purchases rose 22% year over year and basic dog food purchases rose 11%, while premium food purchasers held steady at 31% of owners. Average treat spending fell 11%. On the services side, 51% of dog owners reported doing grooming at home, while professional grooming, boarding, and mobile grooming visits all declined in 2025.
Spending by Generation and Where People Shop
62% of Millennial and 52% of Gen Z pet owners reported increasing spending on their pets over the past year, even as overall industry-wide growth moderated. Shopping habits have shifted online as well: 53% of pet owners purchased pet products online versus 45% in-store, with Millennials the most likely generation to shop online (57%), while Gen Z's online-shopping share held roughly steady between 2024 and 2025 even as it rose for other generations — many younger owners instead discover products through social platforms like TikTok, YouTube, and Instagram.
Pet Insurance Spending
North American pet insurance premium volume grew 20.8% in 2024 over a 2023 base of $4.2 billion, according to AVMA — one of the fastest-growing categories of pet-related spending, even as owners pull back in other areas.
For a look at the pet care industry driving this spending, see our pet industry statistics page.
For the ownership numbers behind this spending, see our pet ownership statistics page.
Detailed Statistics
| Statistic | Value | Description | Source |
|---|---|---|---|
| Total industry spending (2024) | 152B USD |
APPA State of the Industry
Mar 26, 2026 |
|
| Total industry spending (2025) | 158B USD | +3.7% year over year. |
APPA State of the Industry
Mar 26, 2026 |
| 2026 spending projection | 165B USD | Projected +4.4% growth; ~2 points driven by inflation. |
APPA State of the Industry
Mar 26, 2026 |
| Food & treats spending (2025) | 68.3B USD | 43.2% of total industry spending — the largest category. |
APPA 2026 State of the Industry Report
Mar 1, 2026 |
| Veterinary care spending (2025) | 41B USD | 25.9% of total industry spending. |
APPA 2026 State of the Industry Report
Mar 1, 2026 |
| Supplies, live animals & OTC medicine spending (2025) | 34.4B USD | 21.8% of total industry spending. |
APPA 2026 State of the Industry Report
Mar 1, 2026 |
| Dog owners' wallet share: veterinary care | 29% | Largest single share of a typical dog owner's pet budget. |
APPA — America's Dog Owners Are Becoming Smarter Spenders
Jul 22, 2026 |
| Dog owners' wallet share: food | 27% |
APPA — America's Dog Owners Are Becoming Smarter Spenders
Jul 22, 2026 |
|
| Average household pet spending (2024) | 1,515USD | Directly surveyed household total; excludes adoption/purchase fees. |
AVMA
Jan 1, 2025 |
| Owners with unchanged spending (2025) | ~50% |
APPA
Mar 26, 2026 |
|
| Owners with decreased spending (2025) | 22% | Up from roughly 12% the prior year. |
APPA
Mar 26, 2026 |
| Discount-retailer dog food purchases | +22% YoY | Trading-down behavior among dog owners in 2025. |
APPA — America's Dog Owners Are Becoming Smarter Spenders
Jul 22, 2026 |
| At-home dog grooming | 51% | Of dog owners; professional grooming/boarding/mobile grooming visits all declined in 2025. |
APPA — America's Dog Owners Are Becoming Smarter Spenders
Jul 22, 2026 |
| Online vs. in-store pet product purchases | 53/45% | 53% online, 45% in-store; Millennials most likely to shop online (57%). | APPA (reported via Pet Food Processing / PetfoodIndustry) |
| Pet insurance premium growth (2024) | 20.8% | North American premium volume, year over year, from a 2023 base of $4.2 billion. |
AVMA
Jan 1, 2025 |
Sources
- APPA — U.S. Pet Industry Reaches $158 Billion in 2025 (Mar 26, 2026) — Total industry spending figures and owner spending-behavior shifts
- APPA 2026 State of the Industry Report — Category Breakdown (2026) — Spending breakdown by category (food, vet care, supplies)
- APPA — America's Dog Owners Are Becoming Smarter Spenders (Jul 22, 2026) — Dog-owner wallet share and trading-down behavior
- AVMA — Evolving Pet Owner Economics (2025) — Directly surveyed average household spending total and pet insurance premium growth
- Pet Food Processing / PetfoodIndustry — Gen Z Pet Ownership & Spending Trends (Trade press reporting on an APPA generational spending report; primary APPA URL not directly located) — Generational spending-increase and online-vs-in-store shopping percentages
The Big Picture
Total pet industry spending keeps setting new records, but the underlying behavior looks more cautious than that topline number suggests: a growing share of owners are actively cutting back, trading down to cheaper products, and moving services like grooming in-house. Veterinary care and food remain, by a wide margin, where most pet-related money goes.
Frequently Asked Questions
Data Disclaimer
Information on this page is compiled from publicly available reports, surveys, and industry publications. PetNurture does not conduct original research and cannot guarantee the completeness, accuracy, or timeliness of third-party data. Users should verify statistics directly with the original source before making decisions based on this information.